
On this page
Part 1 set the rules, built the fabric twin and walked the ten-hypothesis investigation with a harness that proves it names the right failure. This part is the operational half: how Nexus Dashboard tells FabricSRE that something happened, how a pile of anomalies becomes one incident, how a fix goes through NDFC with an approval bound to the exact lines a human read, and how the same tools answer "what changed" and work from Claude Code. It includes a full incident, from the first export line to the closed ticket, on the two-site fabric from the Multi-Site post. Code is at github.com/aramidetosin/fabricsre.
Making Nexus Dashboard speak first
Polling an anomaly API every minute works, but it is the wrong shape for an on-call tool. Nexus Dashboard 4.3.1 can export anomalies to syslog, email, a message bus or a webhook, per fabric. Three API calls set it up on this cluster, and the README in the repository lists the settings:
- A platform log server under Infra settings, pointing at the runtime host on UDP 514.
- System anomaly streaming to that server for all four severities.
- Per fabric,
externalStreamingSettings.syslogwith the server name and the four anomaly levels. Do not send a facility value: the API rejects every string I tried and sets LOCAL0 on its own.
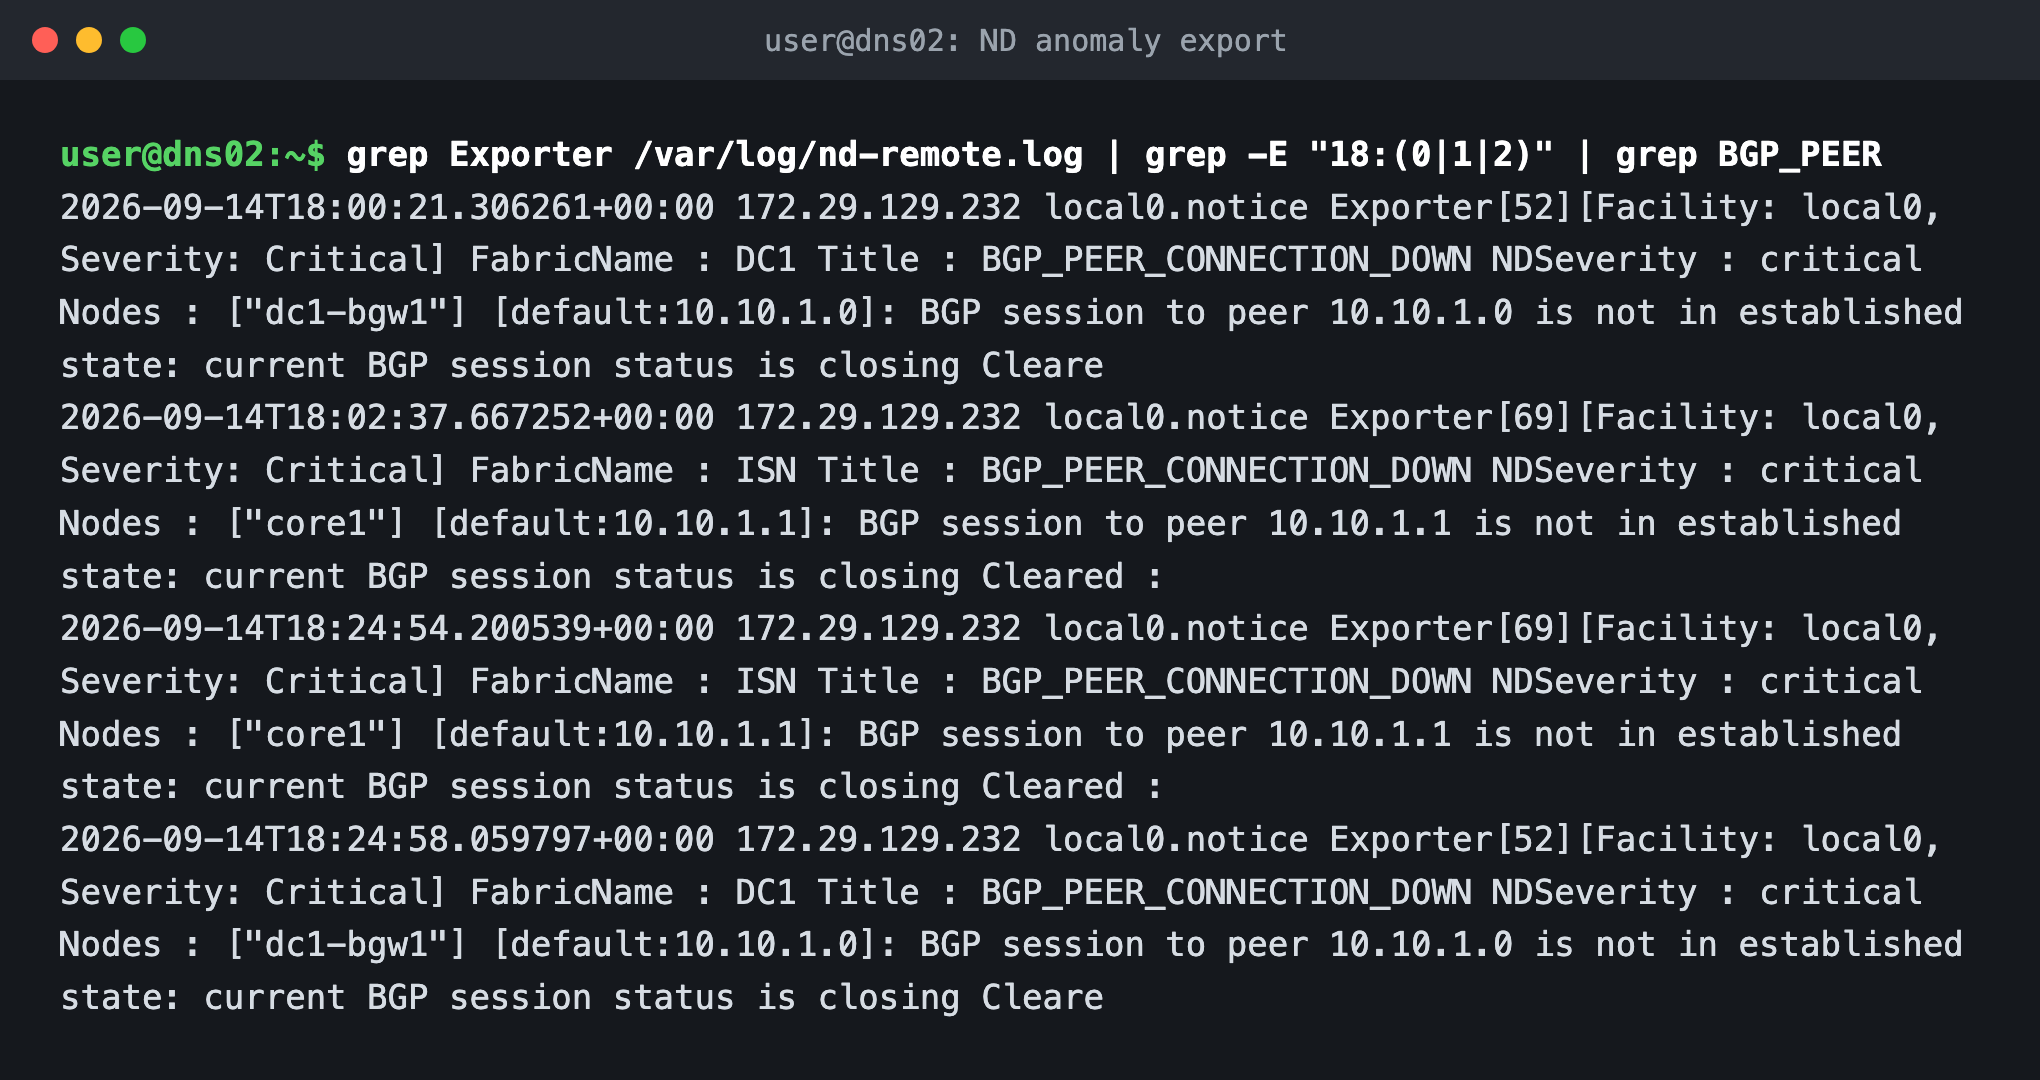
What arrives is one line per anomaly, raise and clear, with the fabric, the title, the severity, the nodes and the text. The receiver is plain rsyslog writing everything from the network into one file with the sender address.
Nexus Dashboard also produced two kinds of noise on this fabric, and you need to understand both before you let anything correlate. Every interface that is admin up without a cable raised a minor connectivity anomaly: 362 on DC1 alone, 118 on the ISN. And with telemetry on, every N9K-C9300v interface reports 100 percent utilisation whatever the load, which shows up as critical utilisation anomalies.
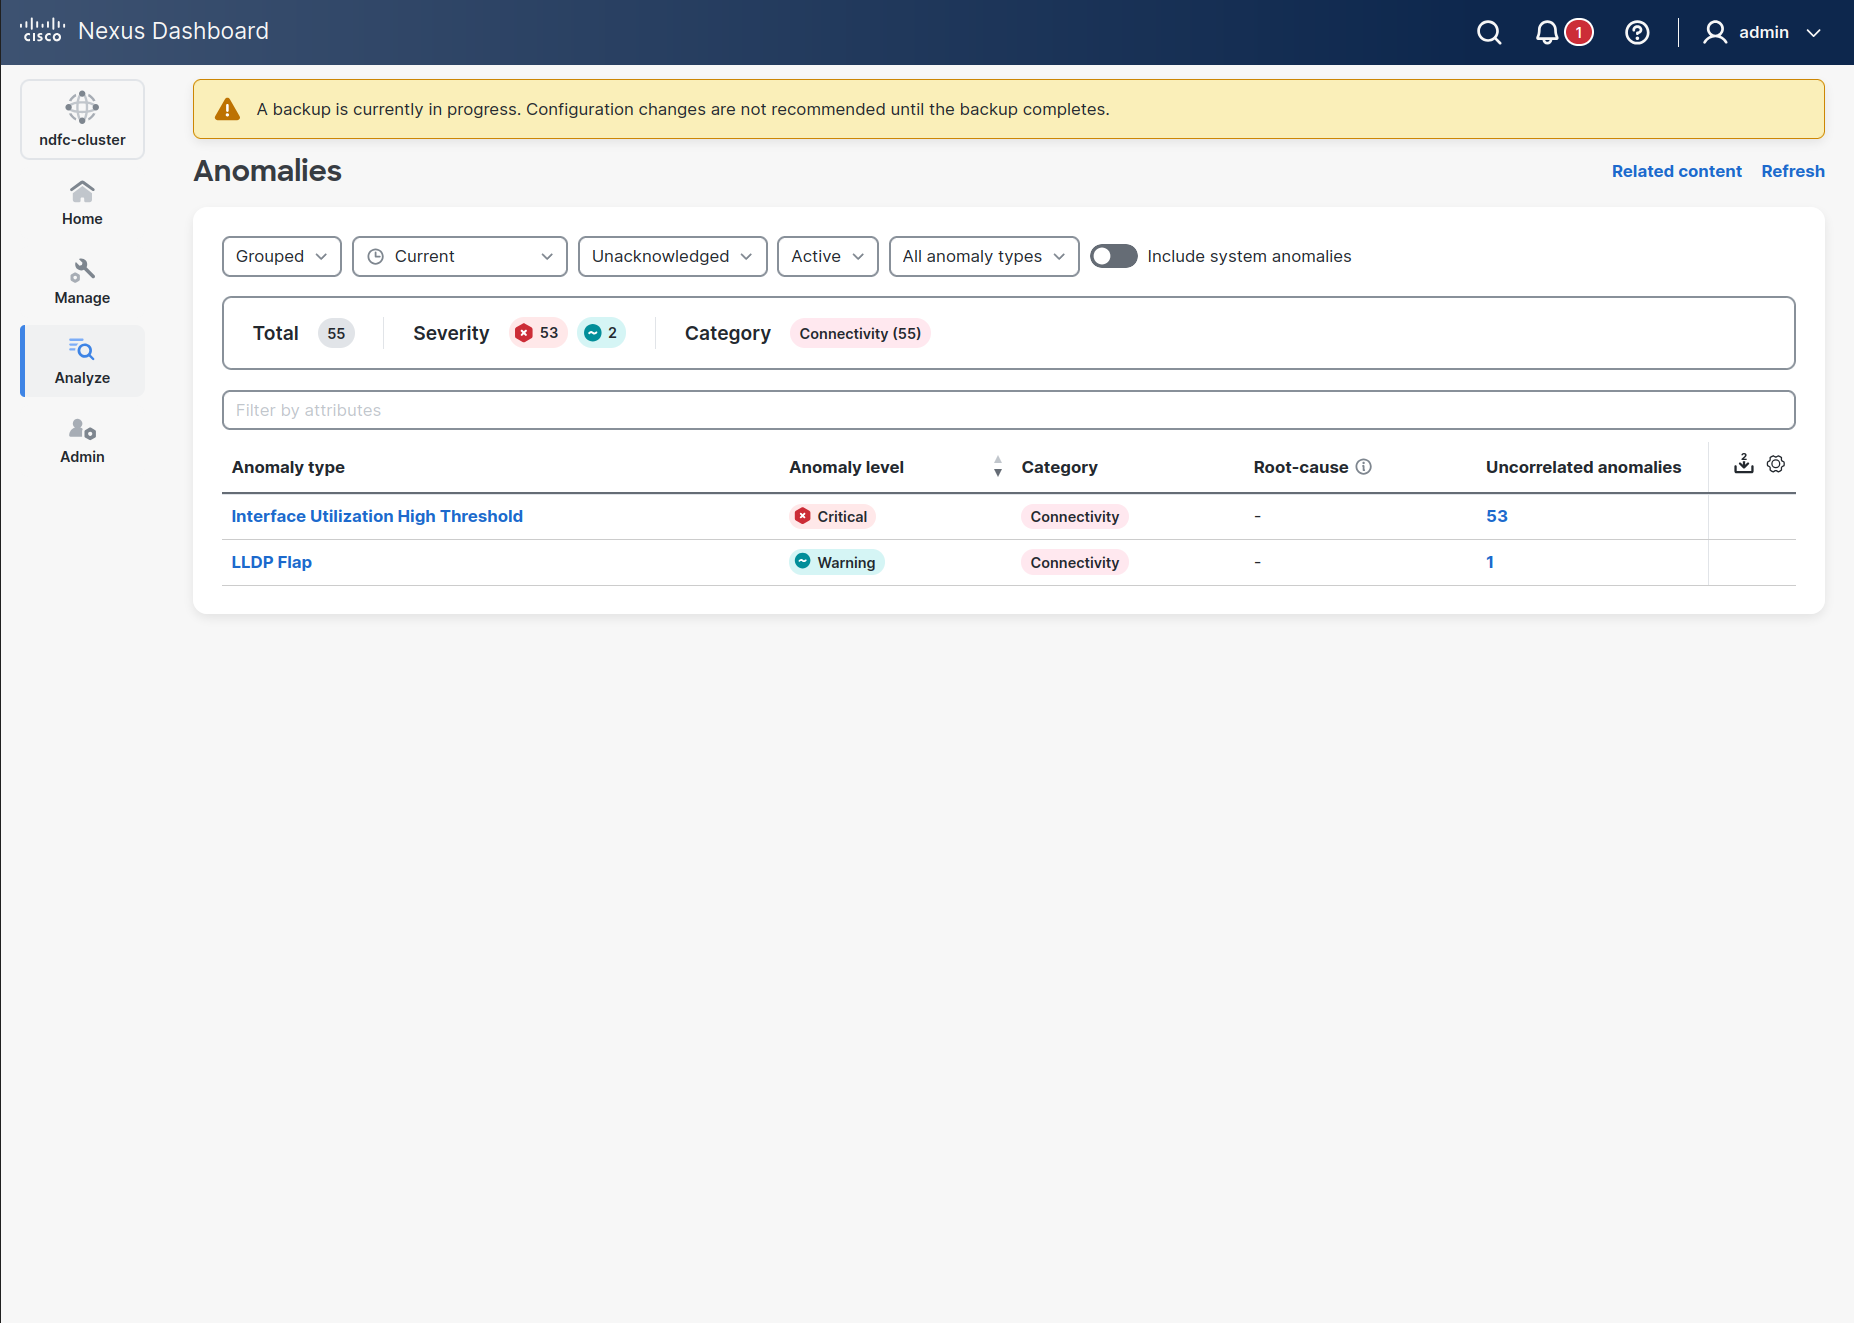
The first kind is handled in Nexus Dashboard itself with one post-processing rule: title CONNECTIVITY_INTERFACE_STATUS, severity minor, category connectivity, scope all fabrics, action suppress, applied to active anomalies. The API needs a top-level suppressActionAcknowledged: true that the schema does not list. Thirty seconds after the rule was created, none of the three fabrics reported a minor anomaly, and a real link fault never uses that title, so nothing real is hidden. The second kind is handled in FabricSRE with a platform rule: on that switch model, utilisation anomalies carry no information and are recorded as suppressed with that reason.