
On this page
Your pod is Running. Your Service exists. The curl still hangs. Often Kubernetes is not being mysterious; you just do not know which point on the request path stopped answering. The fix that stuck for me was to stop reading architecture diagrams and trace traffic the way a request actually travels: outside-in, one checkpoint at a time.
Many Kubernetes diagrams stop at a "Load Balancer" or "Ingress" box. In a self-managed environment, that box still has a route through a data-center fabric. This post follows one HTTPS request from a client to a pod through a Cisco Nexus VXLAN EVPN fabric and Cilium, with the command I used to verify each checkpoint and a failure mode to investigate there.
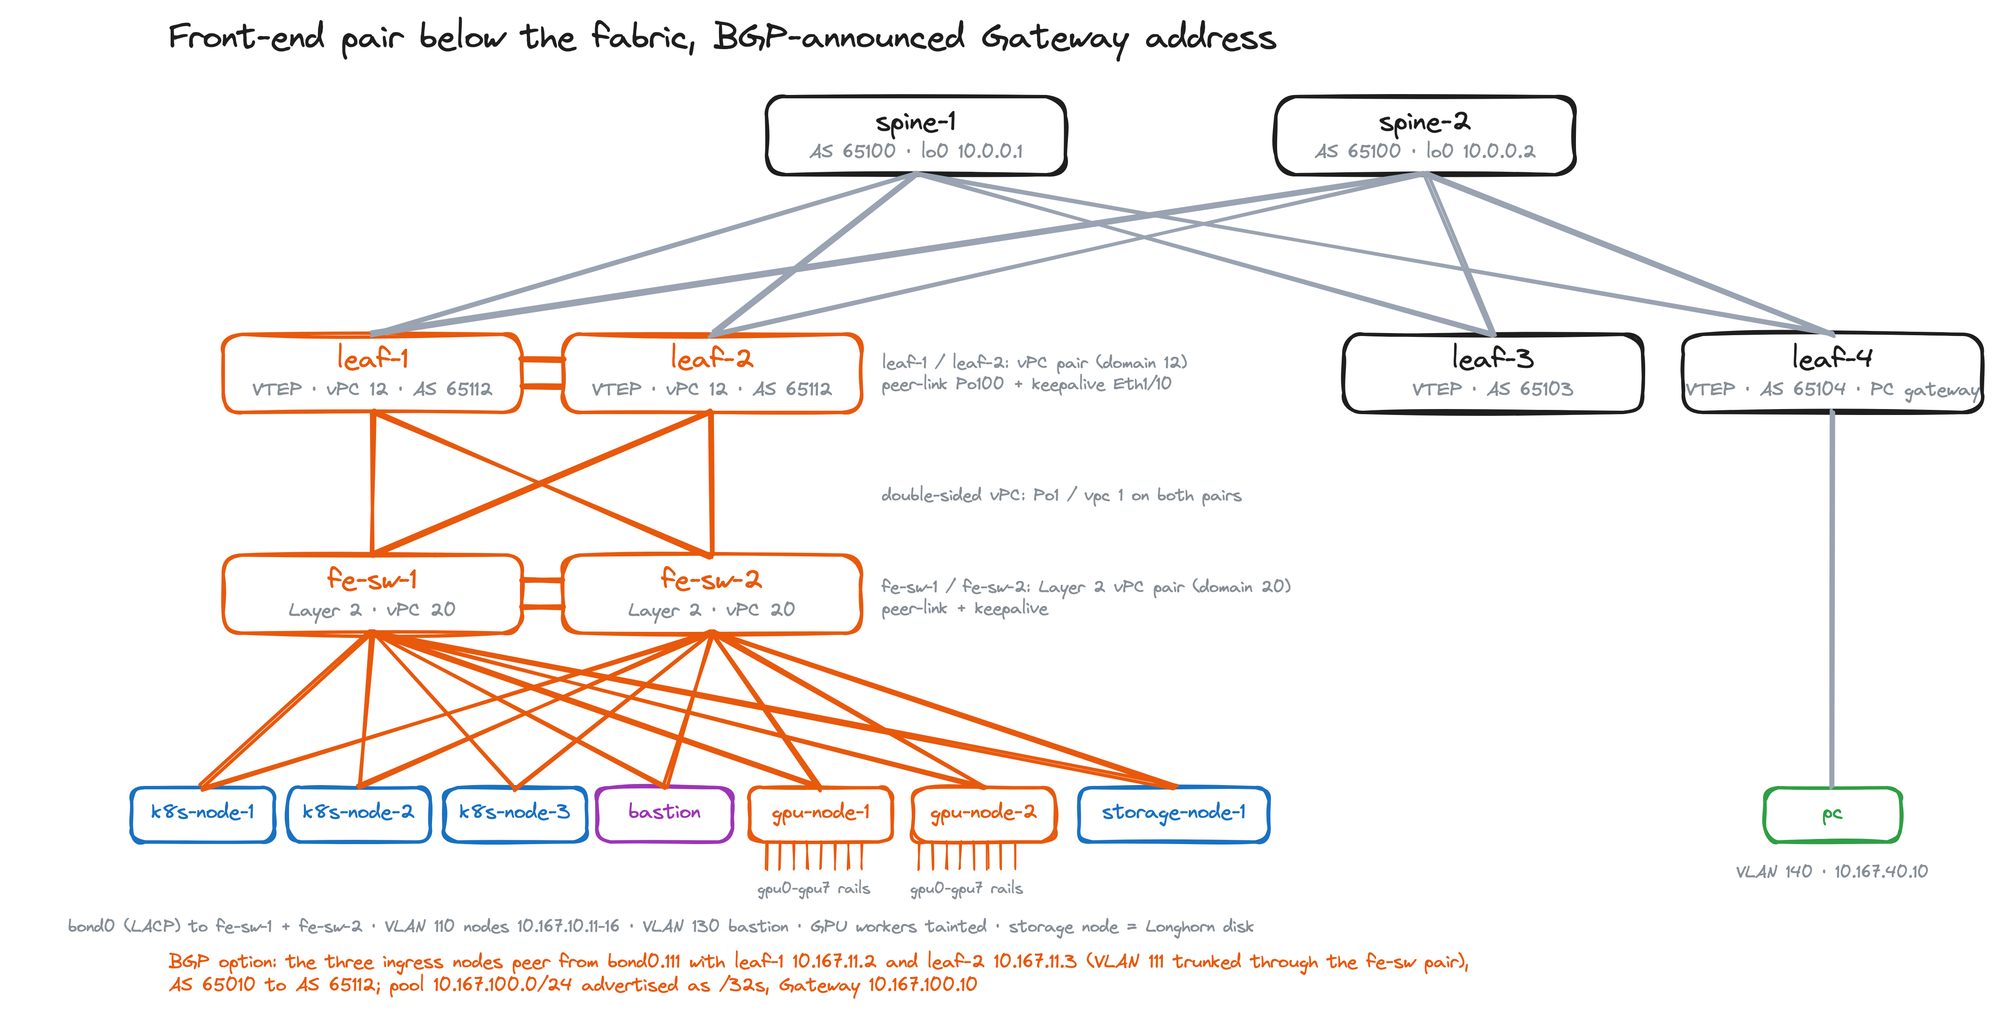
This is design 4 of a set I've been building: a six-node kubeadm cluster on a Cisco Nexus VXLAN EVPN fabric running NX-OS, with Cilium 1.19 and the Gateway API, and the Gateway address announced to the fabric over BGP. The terminal panels render verbatim excerpts from the validation, trace, and audit captures; the observations here are specific to this topology and software combination.
The path, in one picture
Here is the path on one page: where to look at each checkpoint, the command used to verify it, and a failure mode to investigate there. Checkpoints 3 to 6 are the fabric; checkpoints 7 to 9 are the cluster.
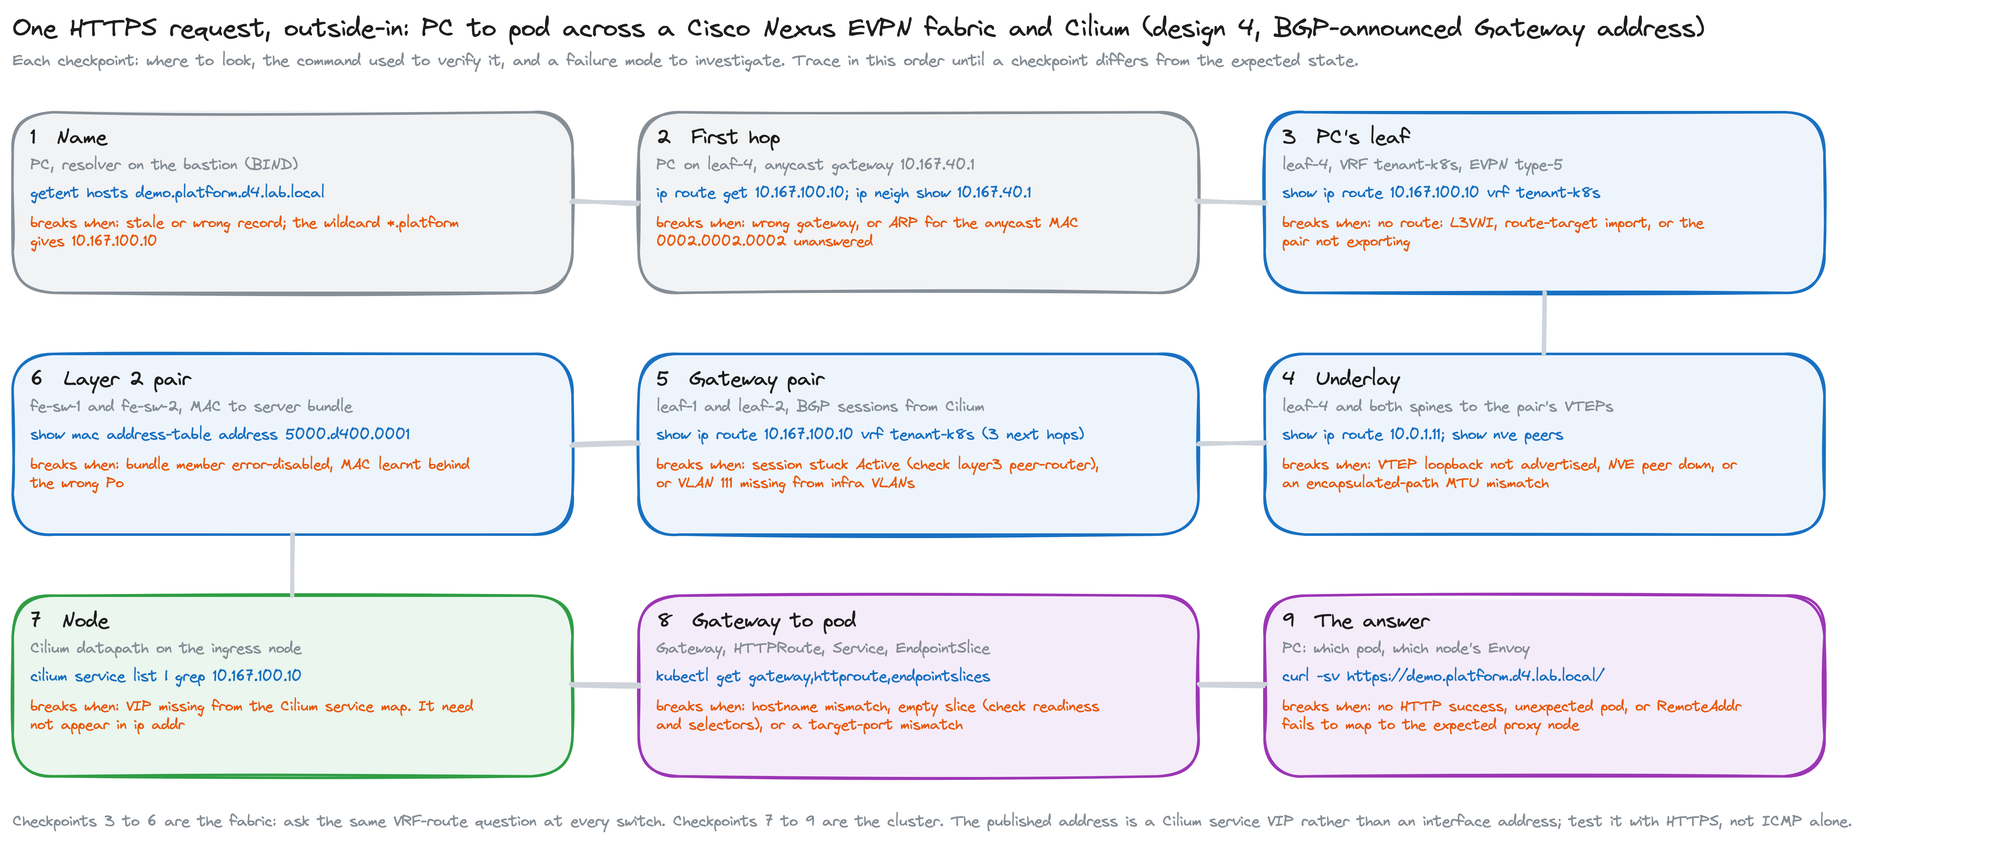
The topology behind it: leaf-1 and leaf-2 are the VTEP leaves and the pair the servers ultimately hang off, through a double-sided vPC down to a pair of plain Layer 2 switches. The client sits on a different leaf. One Gateway address, 10.167.100.10, serves every app by host name.