
On this page
How many users can one copy of a language model serve? Not the number of CPUs or GPUs: the key-value cache decides it. This is part 2 of Inference-Aware Load Balancing for LLMs, and it opens up the model server, vLLM, running a real 24-billion-parameter model (LFM2.5-24B-A2B) on a CPU node of the lab. Every setting is shown in the Kubernetes configuration before its effect is measured: the KV cache in 4 and 8 GiB, thread binding on and off, prefix caching cold and warm, continuous batching read live from the server's metrics, and a simulator timed from these numbers for the rest of the series. This post goes with a video on the LevelUP I.T. YouTube channel.
What you'll see
- The four parts of a model server, and continuous batching.
- The model read from its own config.json: grouped-query attention, convolution layers and a mixture of experts.
- The KV cache formula, checked against vLLM's log, and its capacity doubled by one setting.
- Thread binding on a CPU, measured: 2.7x on one stream.
- The server's own signals on
/metrics, and a batch watched live. - Prefix caching: 2.31 s to the first token cold, 0.25 s warm.
- The llm-d inference simulator, timed from the real model, and exactly where it differs.
Inside a model server
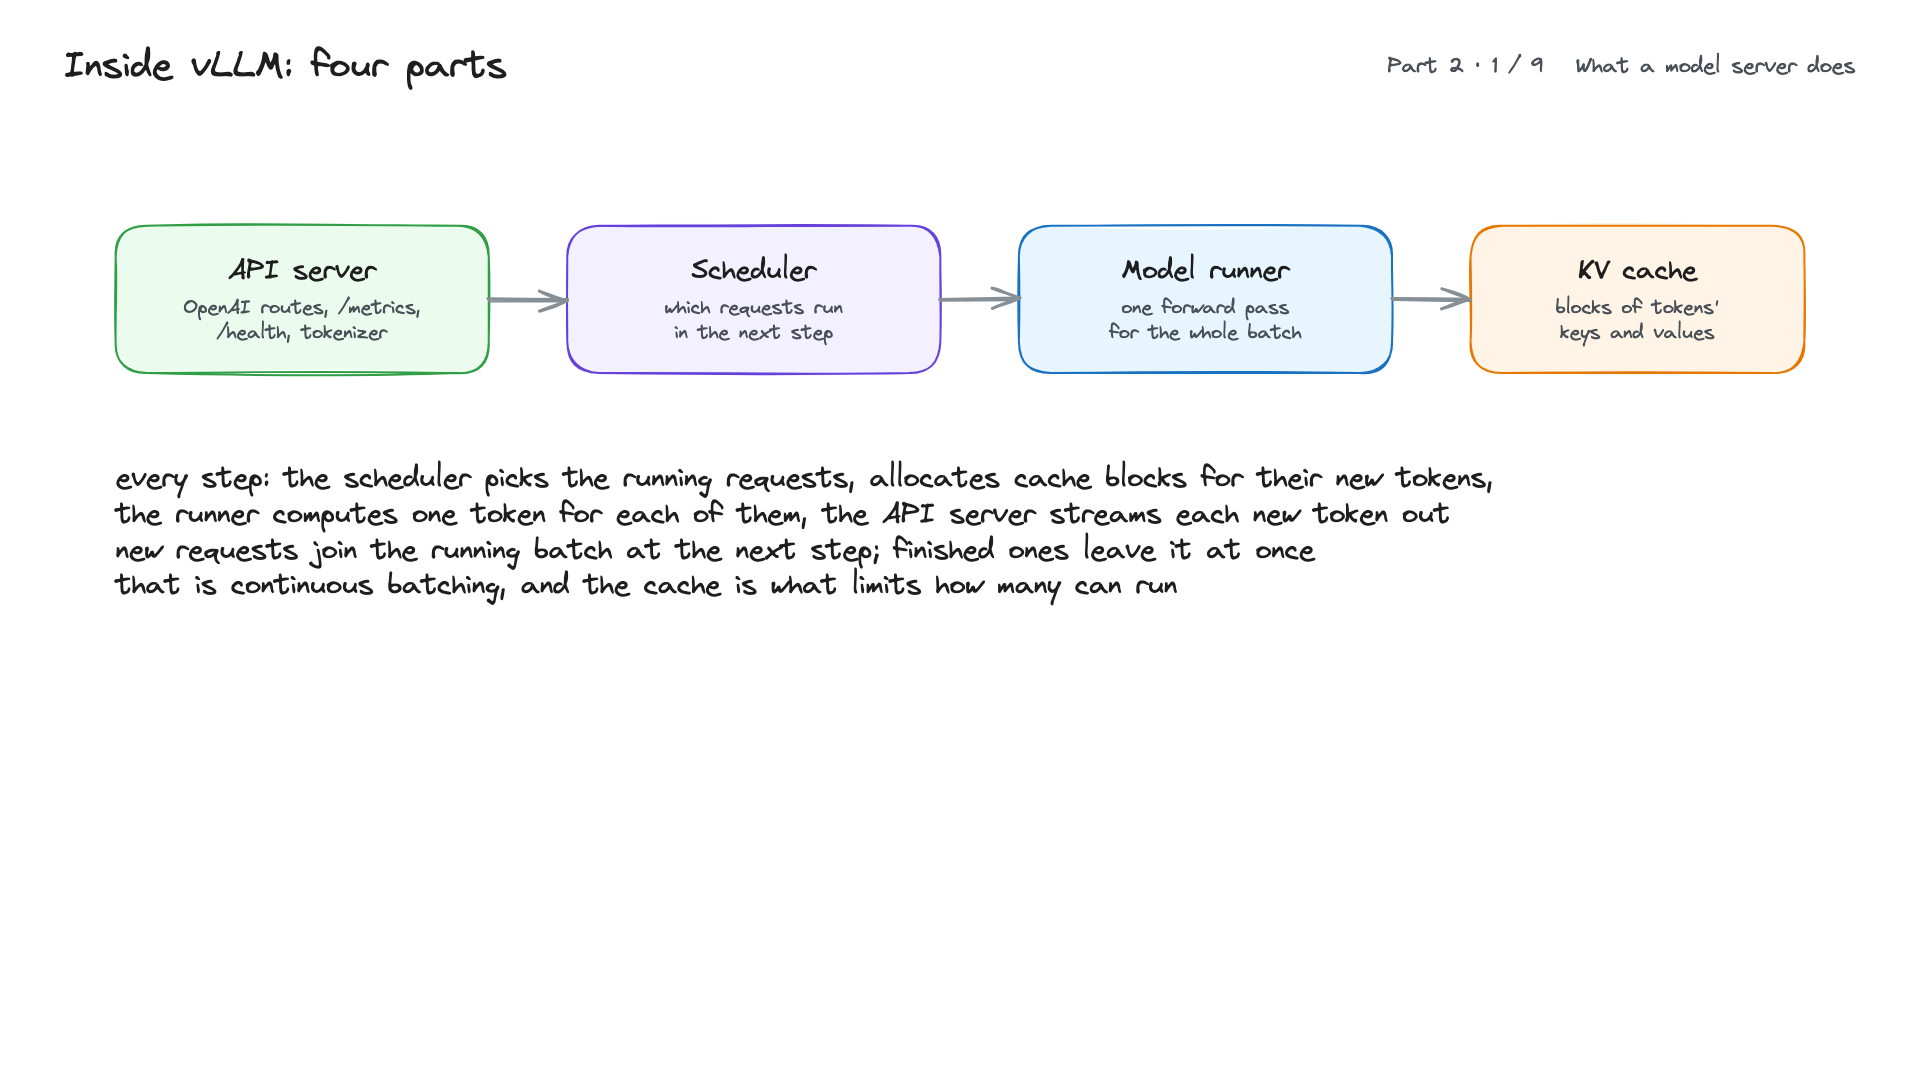
vLLM has four parts that matter to a load balancer. The API server speaks the OpenAI routes, serves /metrics and /health, and tokenizes text. The scheduler decides at every step which requests run. The model runner does one forward pass through the model for the whole batch. The KV cache holds, in blocks, the attention keys and values of every token of every running request. At every step the scheduler picks the running requests and allocates cache blocks for their new tokens, the runner computes one token for each, and the API server streams them out. New requests join at the next step and finished ones leave at once: continuous batching. The cache limits how many can run.
The configuration that matters
Where part 1 ended: one LFM2.5-24B-A2B replica on k8s-big and the measuring client on k8s-w2. The fields of the generated Deployment (lab/k8s/inference/models.yaml) that this part changes or relies on:
nodeSelector: {f5lab.test/llm-tier: big}
image: docker.io/vllm/vllm-openai-cpu:v0.32.0-x86_64
args: ["LiquidAI/LFM2.5-24B-A2B", "--revision", "3dc4cd09c9a2a99e1e819693e79d3aba5e9bb4f2", "--served-model-name", "lfm2.5-24b-a2b",
       "--port", "8000", "--dtype", "bfloat16", "--max-model-len", "8192", "--enable-prefix-caching"]
- {name: VLLM_CPU_KVCACHE_SPACE, value: "4"}
- {name: VLLM_CPU_OMP_THREADS_BIND, value: "0-13"}
- {name: HF_HUB_OFFLINE, value: "1"}
readinessProbe: {httpGet: {path: /health, port: 8000}, periodSeconds: 5}
lifecycle: {preStop: {sleep: {seconds: 30}}}
resources: {requests: {cpu: "14", memory: 86Gi}, limits: {cpu: "14", memory: 86Gi}}
Requests equal to limits gives the pod Kubernetes' Guaranteed quality of service: its 14 CPUs and 86 GiB are its own. A model server's memory is mostly weights and cache, and its speed depends on owning whole CPUs, as the binding test below shows.
The model, from its own config.json
jq '{num_hidden_layers, hidden_size, num_attention_heads, num_key_value_heads, num_experts, num_experts_per_tok, vocab_size, max_position_embeddings}' config.json
  "num_hidden_layers": 40, "hidden_size": 2048, "num_attention_heads": 32, "num_key_value_heads": 8,
  "num_experts": 64, "num_experts_per_tok": 4, "vocab_size": 128000, "max_position_embeddings": 131072
jq -r '.layer_types | group_by(.) | map("\(.[0]): \(length)") | .[]' config.json
conv: 30
full_attention: 10- Grouped-query attention: 32 query heads share 8 key-value heads, four to one, which cuts the KV cache to a quarter of full multi-head attention. Each head is 2,048 / 32 = 64 numbers wide.
- Hybrid layers: only 10 of the 40 layers are attention layers. The other 30 are short convolutions that look at the last few tokens and keep a small fixed state per request, not a growing cache.
- Mixture of experts: in each expert layer a router network picks 4 of 64 experts per token, so a token touches about 2 billion parameters ("A2B"), but all 24 billion must be in memory, because the next token may pick different experts. On disk the snapshot is 45 GB: bfloat16, two bytes per parameter.