
On this page
This is part 4 of Fabric Live, a series that builds an F5 BIG-IP lab on a SONiC EVPN fabric and configures it live on camera. Each part goes with a video on the LevelUP I.T. YouTube channel. The lab itself, and how it is built (one file of values, one up.sh, the SONiC EVPN fabric, the Palo Alto firewall, the three BIG-IPs and the validation run), is covered in the first video, Fabric Live 1. Part 3 covered the load-balancing methods and cookie persistence. This part builds the lab's telemetry from nothing.
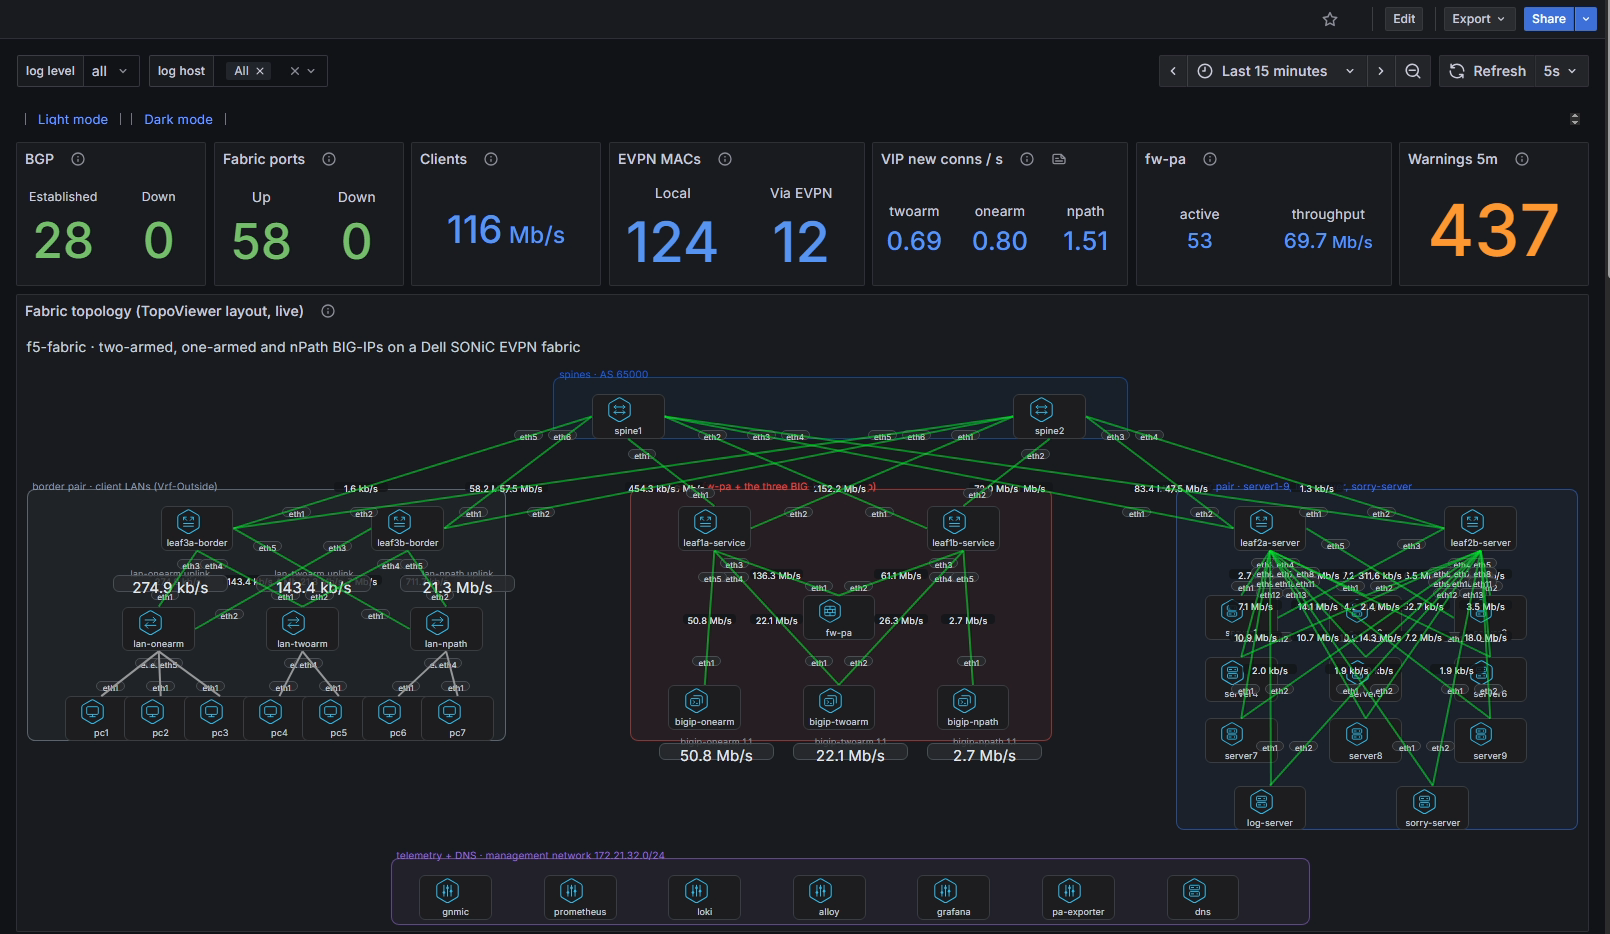
A link goes down in the fabric. How long until you know, and how do you see which link it was, which BGP sessions dropped, and where the traffic went instead? This part builds a telemetry stack on the running lab, step by step: gNMI by hand on a Dell Enterprise SONiC switch, a gnmic collector into Prometheus, syslog from every device into Loki through Grafana Alloy, F5 Telemetry Streaming, a Palo Alto exporter, and a Grafana dashboard generated from the lab's own values. Then the lab is broken on purpose, one fault at a time, while the dashboard watches.
What you'll learn
- Why streaming telemetry replaces polling, and what each piece of the stack does.
- gNMI by hand: capabilities, get, subscribe, the path grammar, and the facts the collector is built on.
- gnmic: per-switch subscriptions, BGP per named neighbour, processors, a separate MAC-table output.
- Prometheus: targets, series, labels,
rate(), and the reaction time of streaming in and scraping out. - Syslog in two formats through Alloy into Loki, host labels, LogQL.
- F5 Telemetry Streaming: package, declaration, pull consumer, and the three collectors excluded on BIG-IP 21.1.
- A PAN-OS exporter, a provisioned Grafana dashboard, and five fault scripts.
Why streaming telemetry
For decades, network monitoring meant polling: a management station asks every device for its counters over SNMP, on a timer. It has three structural limits. The station decides when to ask, so anything that happens between two polls is invisible; a session that flaps for twenty seconds between two five-minute polls never appears at all. Every poll costs the device work, so operators poll less often than they would like. And the data model is a tree of numeric object identifiers, with vendor-specific MIBs beyond the standard ones.
Streaming telemetry turns the relationship around. The client subscribes once, and the device pushes updates over a long-lived connection: on a schedule, or the moment a value changes. The transport is modern (gRPC over HTTP/2 with TLS), and the data is described by structured, vendor-neutral models (OpenConfig) addressed by readable paths rather than numeric OIDs.
A telemetry stack is a set of pieces with one job each. A collector holds the subscriptions and turns what arrives into metrics. A time-series database stores those metrics and answers queries over time: here, Prometheus. A log store keeps the text the devices send: here, Loki, fed by an agent called Alloy. A dashboard queries both and draws the answers: here, Grafana.