
On this page
The traffic tcpdump cannot see
RDMA's whole value is that the kernel never touches the data path. That has an awkward consequence the first time something misbehaves: your favorite tools are blind. Here's the blindness measured, on my SR-IOV lab fabric, while an RDMA write test hammers the port:
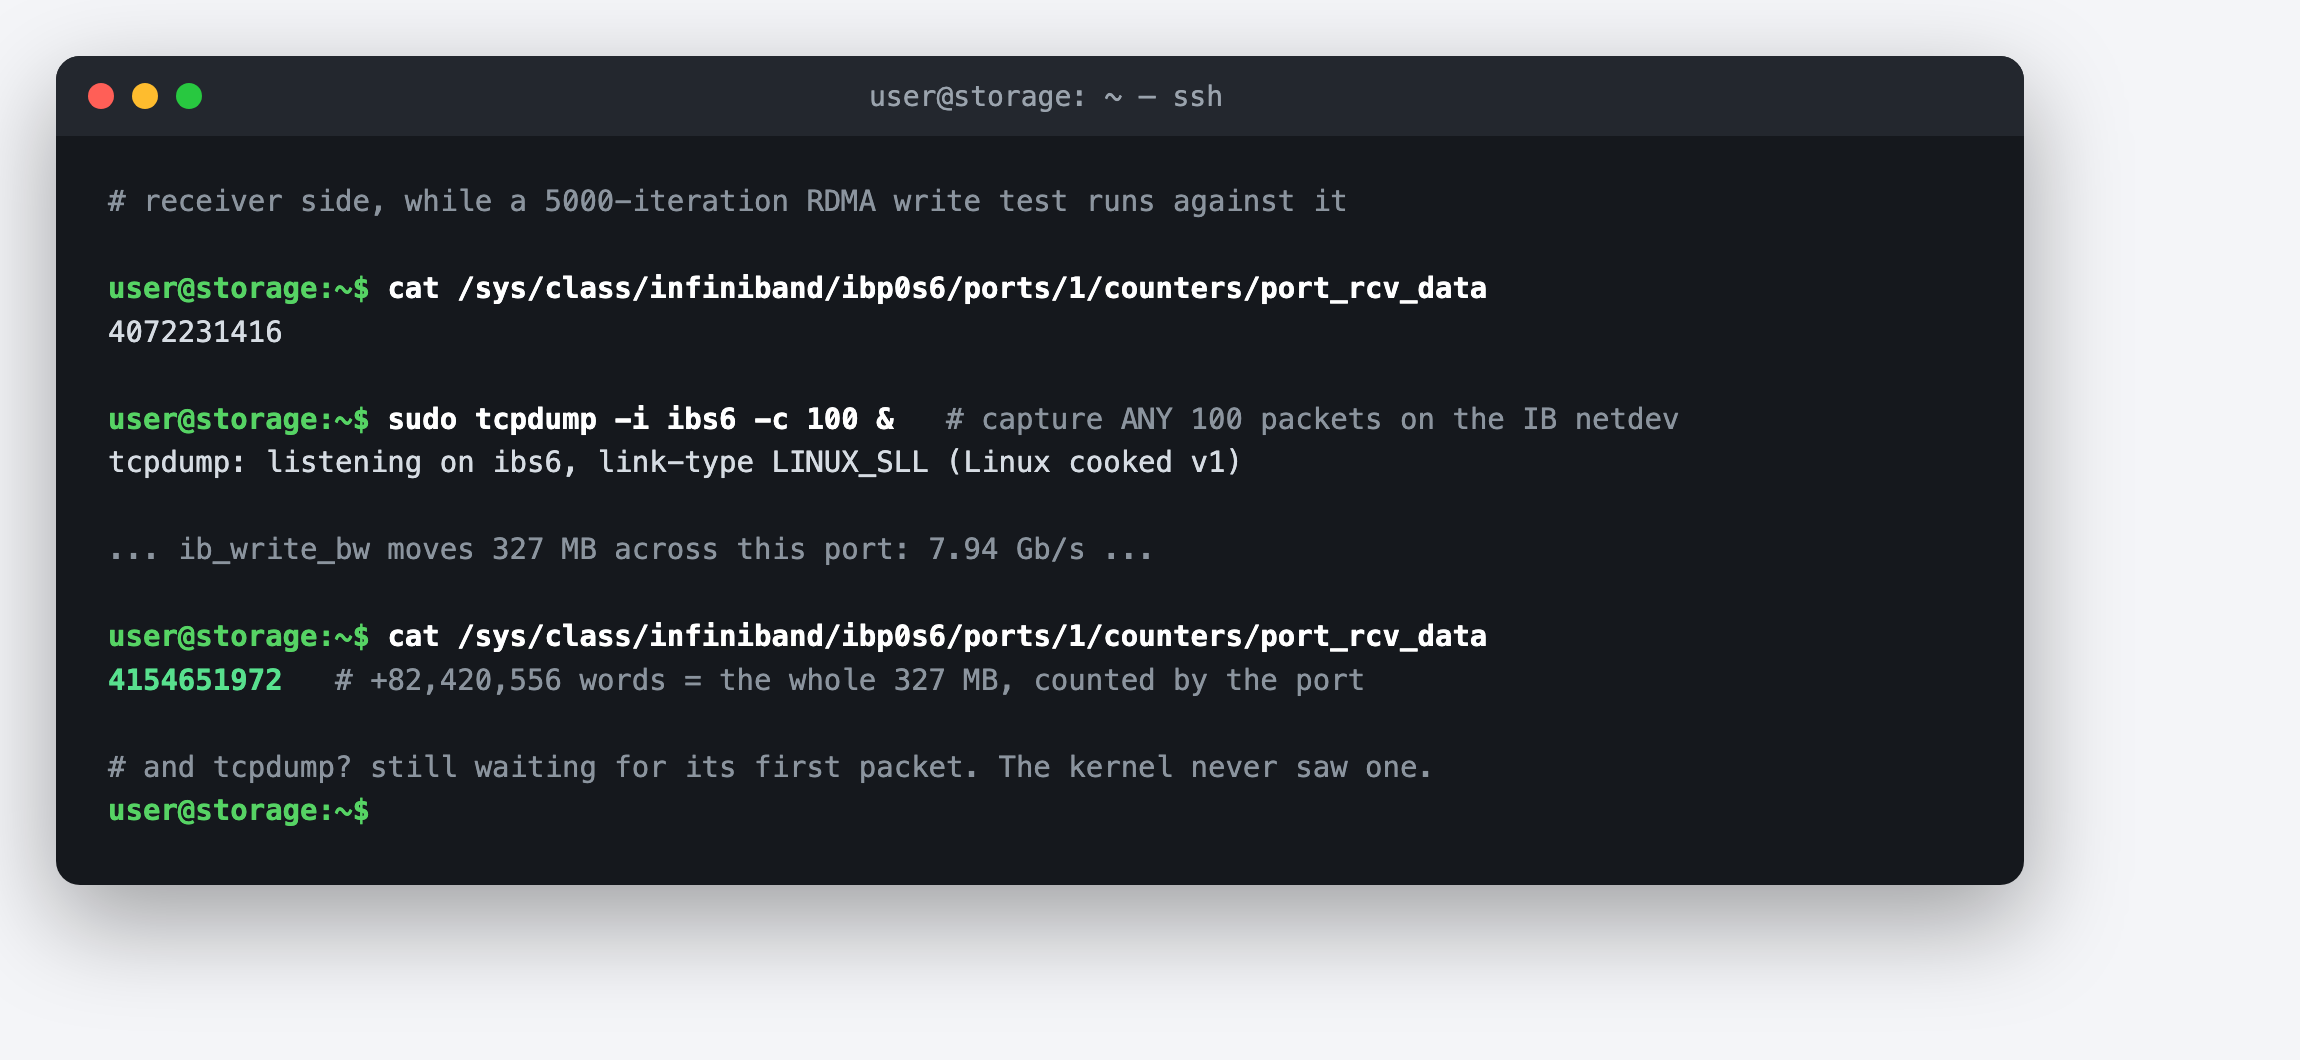
The hardware counters prove the traffic is real; tcpdump proves the kernel wasn't invited. Great for performance, terrible for troubleshooting. So how do you actually look at RDMA on the wire?
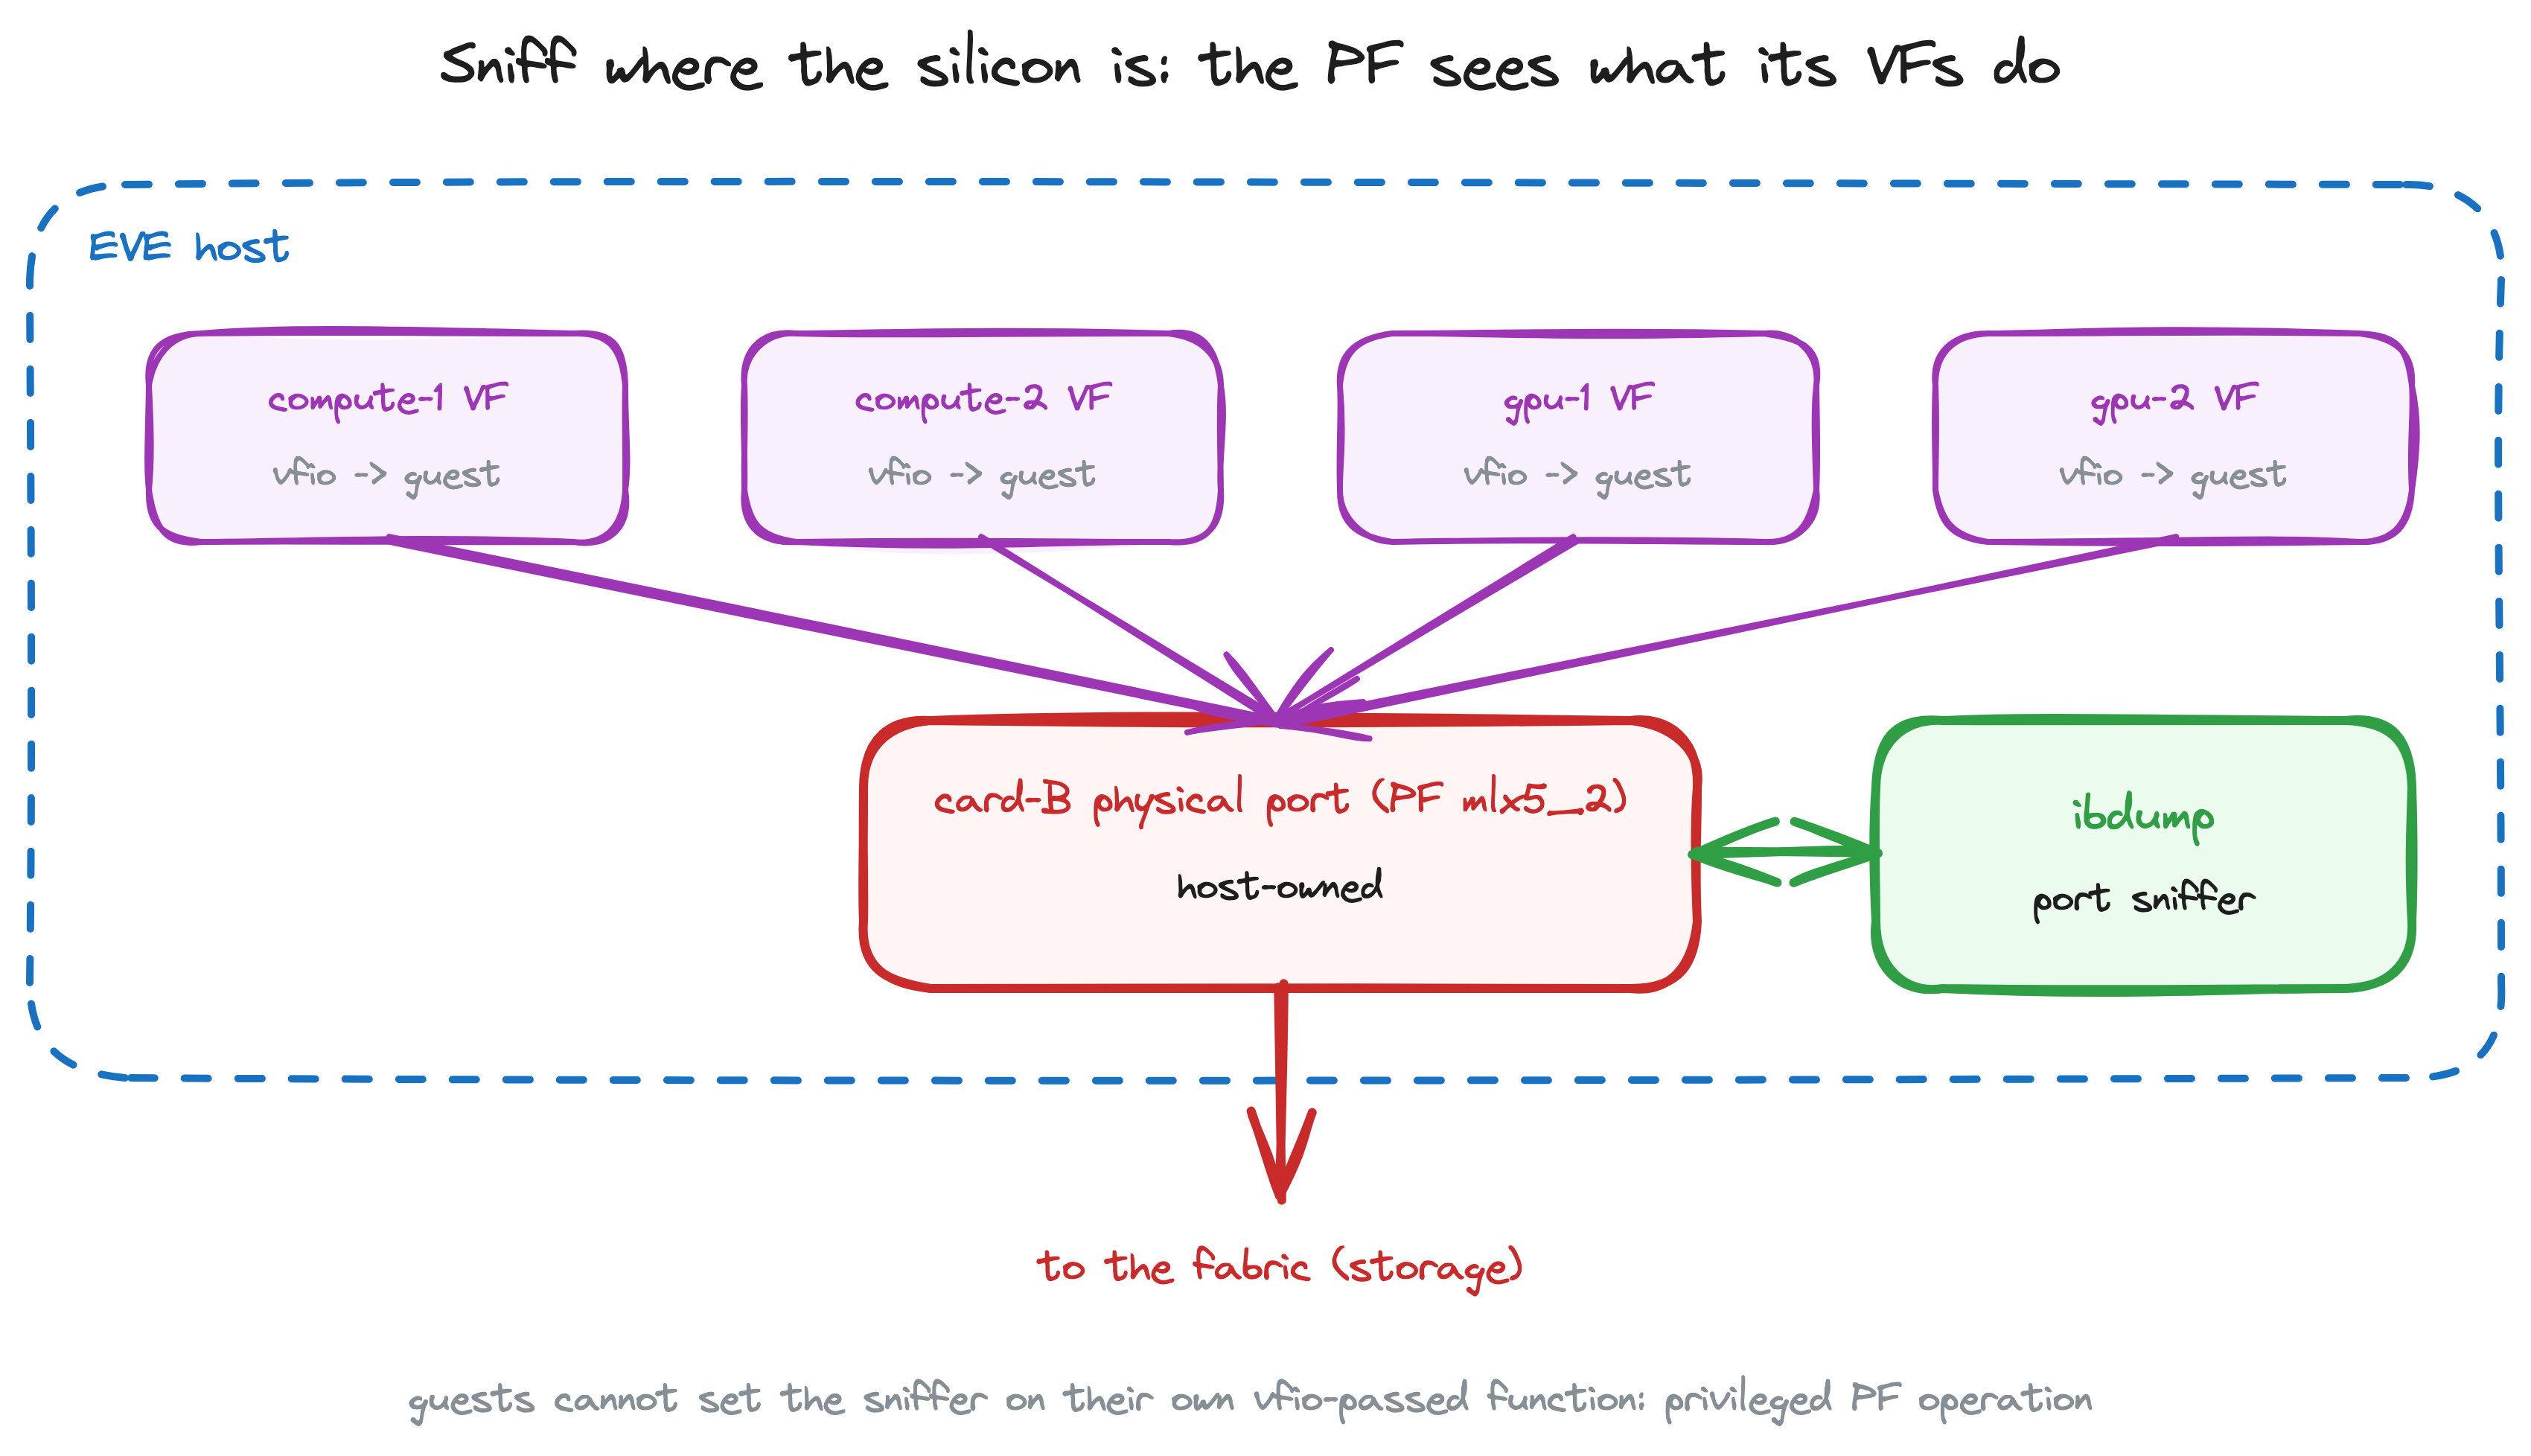
Sniff where the silicon is
Mellanox HCAs have a hardware port sniffer: the NIC itself mirrors everything crossing a physical port into a capture queue. The tool that drives it is ibdump, and the catch is a permission: arming the sniffer is a privileged operation on the physical function. Try it from inside one of my guests, whose function arrived via VFIO passthrough, and the firmware politely refuses. But my topology has a loophole that most SR-IOV setups share:
The capture
Running ibdump on the host against that PF while two guests ping across the fabric:
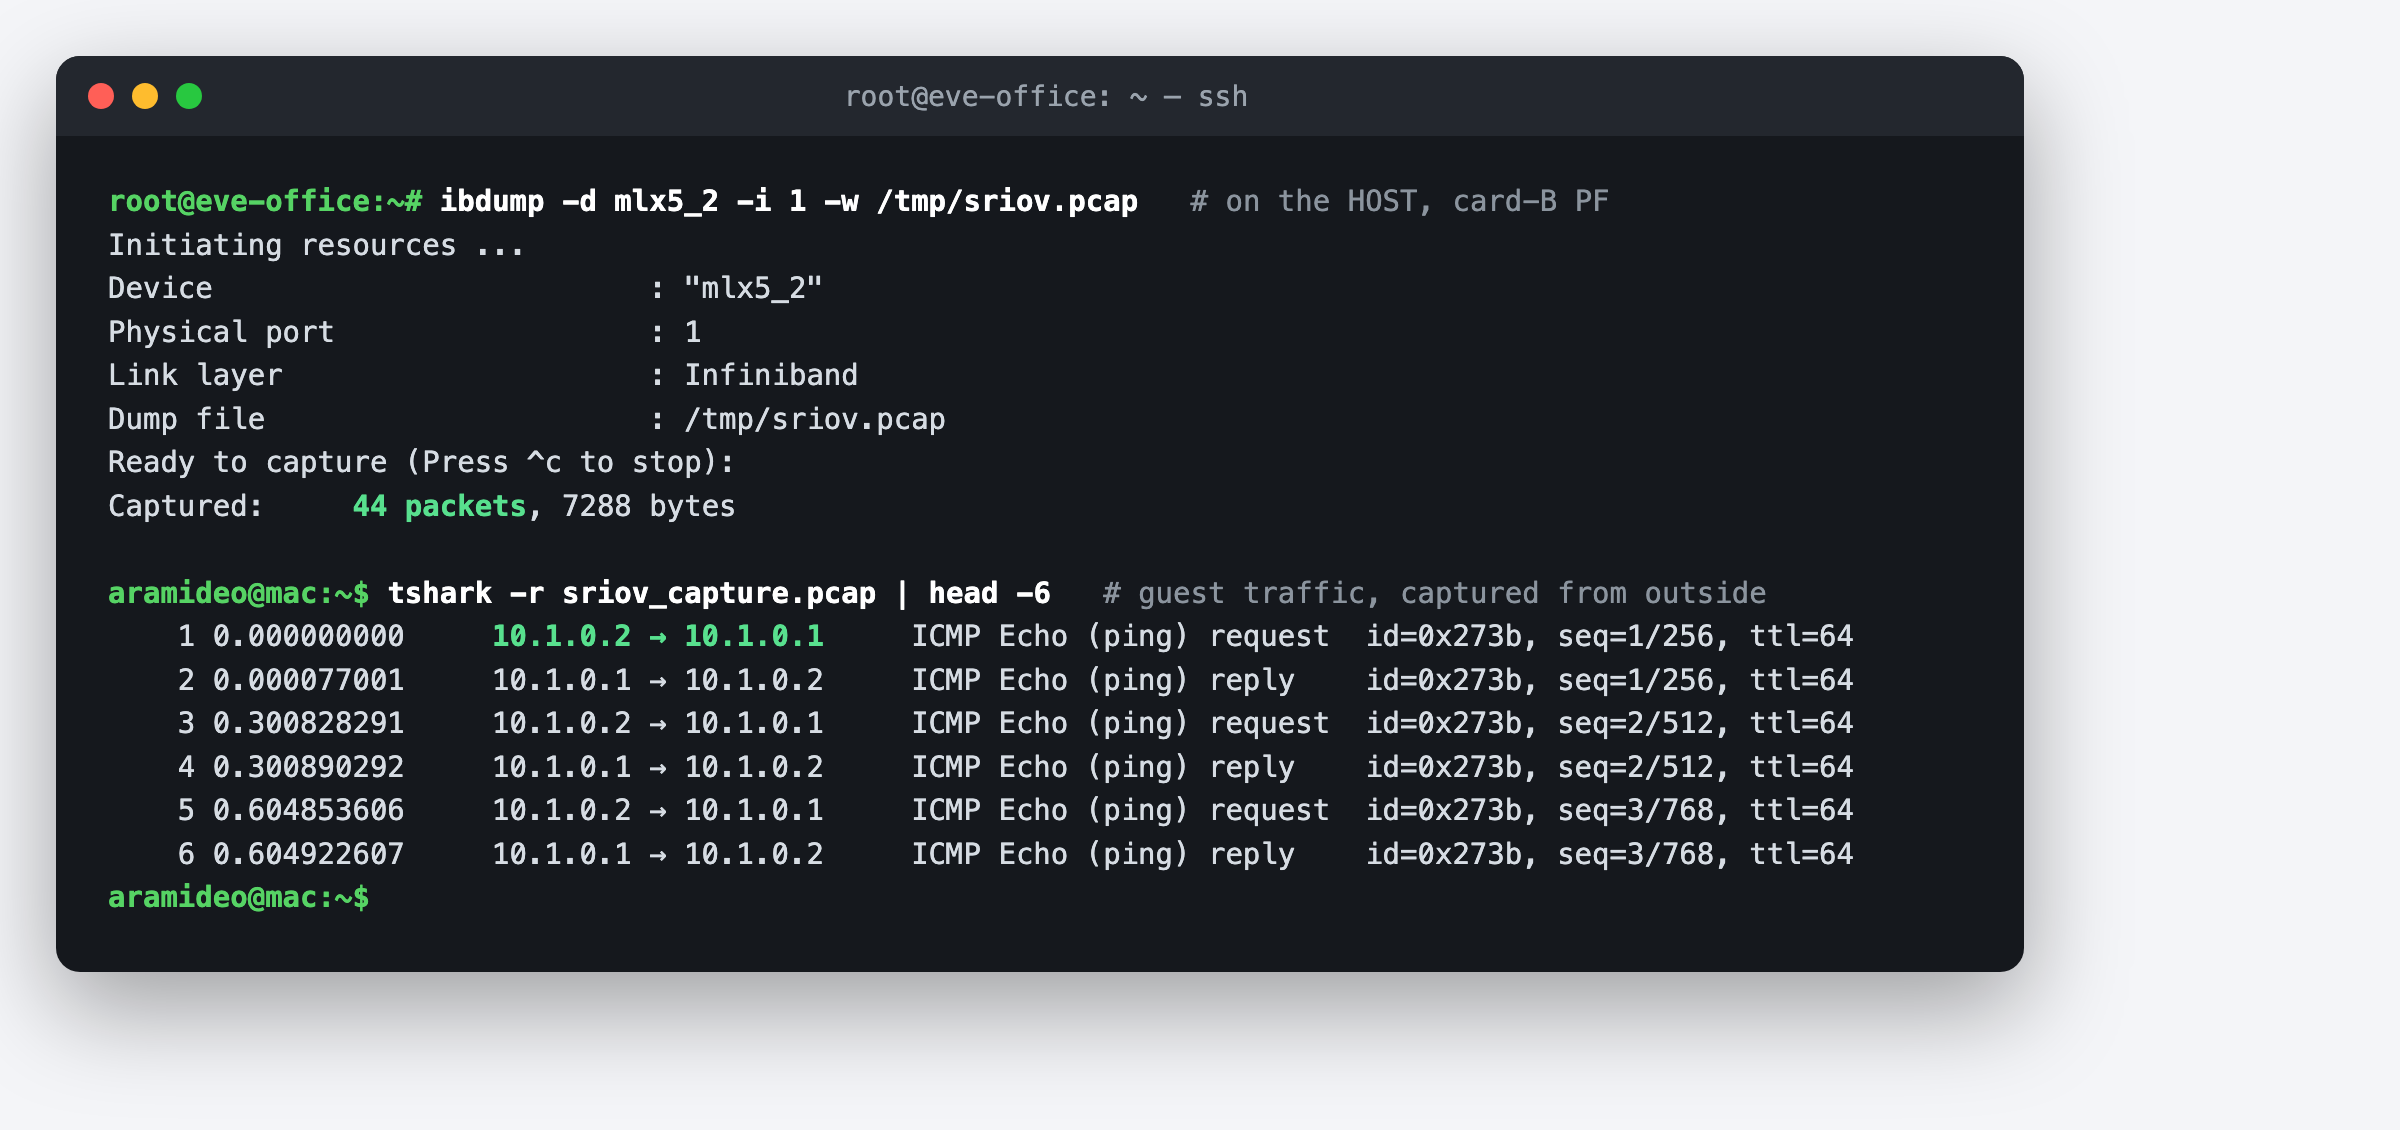
That's IPoIB-encapsulated ICMP between two VMs, complete with InfiniBand headers, LRH and BTH and all, readable in Wireshark's InfiniBand dissector. Two practical notes: open the pcap in Wireshark, not tcpdump, which misreads the link type; and the sniffer is a read-only mirror, so capturing doesn't perturb the traffic it watches.
What the capture proves
Beyond debugging, the capture is an audit tool. My compute nodes live in a partition that forbids them from talking to each other (the opensm post covers why). Their mutual silence in a port-level capture, while both chat happily with the storage node, is the strongest possible evidence that the isolation is real: not a firewall rule that might be bypassed, but an absence of packets at the only place they could exist.
There's a security lesson in the same observation. If you rent VFs to tenants, remember what PF ownership means: the infrastructure operator can watch every byte your virtual function sends. On my fabric that's a feature. In someone else's cloud, it's the trust model.
The nugget: you can't tcpdump traffic on a native InfiniBand fabric, and that's by design. But the physical port sees everything, and if you own the PF, so do you: ibdump -d <pf-device> -w capture.pcap, then Wireshark.